
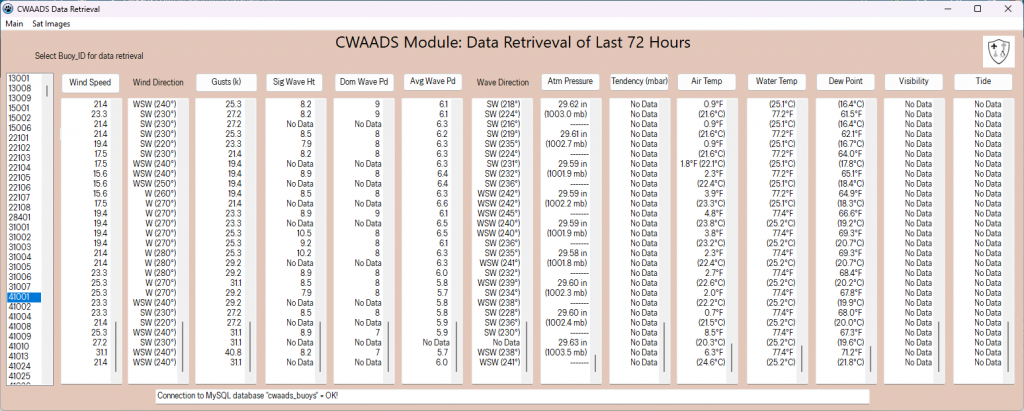
The backbone is done. As of June 2, 2025.
My next step is to incorporate graphs denoting longitudinal analysis of the data.
Additional functionality:
- Interactive map denoting the location of the buoys
- Native satellite image display. They currently display, but through the native browser of the operating system.
- Secure connection to the SQL server. This will allow remote connections to core server.
- Mathematical functions for error-correction of month-over-month and year-over-year analysis.
Leave a Reply